


Start integrating today!
1
Get started (by filling in this form)
2
Brief intake
3
Gain access
4
Kickstart with SYMSON
Get started today!
SYMSON helps you with integrating your software in a future-proof and reliable way.
Make Use of The Intelligent Platform to Automate and Optimise your Prices. The features available in SYMSON can help you customise the platform to your needs.
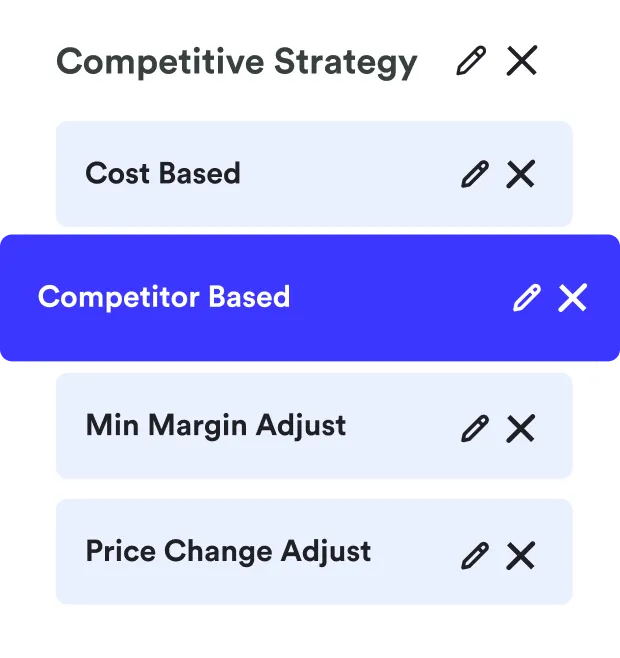
With the Strategy Builder in SYMSON you can select the strategy that best fits your business case. The strategies available can all be customised to fit your needs. The software allows you to make changes to each strategy quickly and easily.

SYMSON offers the opportunity to collect daily market prices from all the vendors in the market. The competitor analysis feature will adjust your prices automatically and you will be aware when new competitors enter the market.
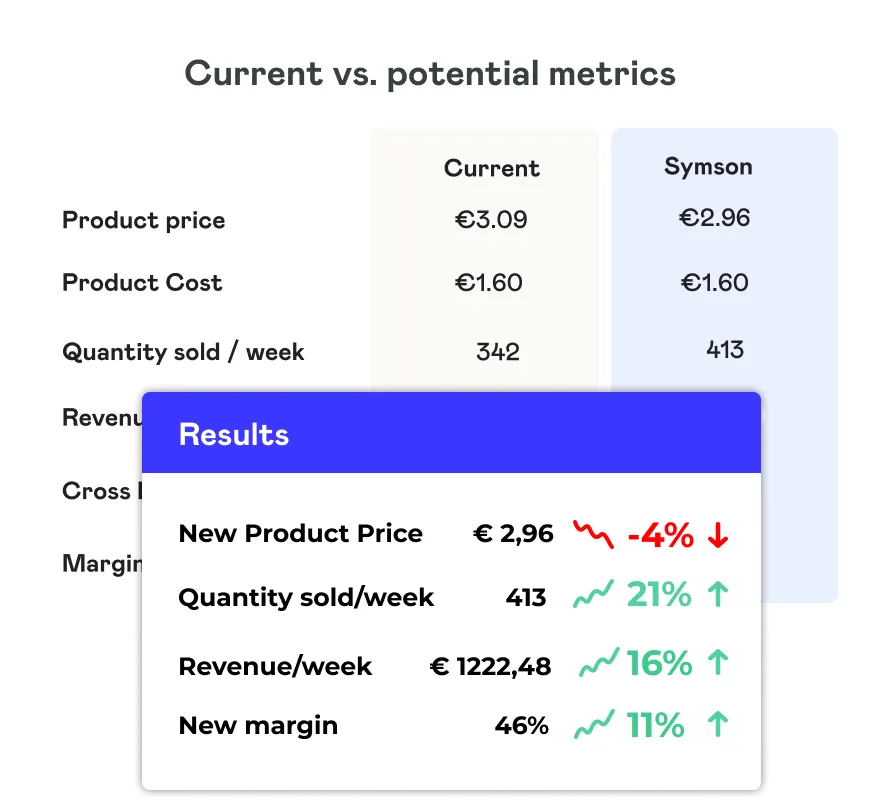
SYMSON uses the AI and ML tool to run analysis on all products. Depending on what you choose it automatically suggests the most optimal price for higher revenue or higher margin. SYMSON offers the opportunity to predict optimal prices based on elasticity for every product on a daily, weekly on monthly time frame.

It is important that the results can be trusted and that management gains insight into the data quality. In the Data Quality Cockpit, management gets an overview of important factors such as data variance, correlation and quantity per price forecast.

In the strategy builder in SYMSON is where you can find business rules such as “Mininum Margin”, “Price Roudning” and others so that your prices can fit your exact needs even more.

The dashboard in SYMSON can show you at a glance your most sold and most profitable products so that you are always informed on which products bring the most value to your company.

The scenarios in SYMSON uses analyses of competitors and price elasticity to predict the future demand and the most optimal price for the highest revenue.

Optimising your products for margin is done automatically by the AI and ML tool using historical data. It runs scenarios to predict the best price for highest margin and allows to easily export this data into your API.

The software analyses the historical data from previous time periods and predicts the changes in demand in different seasons so that you are always ready for demand spikes.
The strategy builder allows you to easily build different strategies and scenarios for all countries you operate in indepently from each other. Thus you can set up your prices to fit the different demographics easier than ever.

Going into the Results fo each scenario and analyses will show all the data that has been used to get to the final results. This transparent approach can lead to more insights and clarity when it comes to your pricing.

SYMSON allows you to correct the current cost-prices with inflation so that historical data is properly cleaned for optimsations.


